Our new analytics designs resulted in increased usage and positive user feedback. Our roadmap became a company priority.

Founded in 2008, Sauce Labs is a leading provider of automated software testing solutions, enabling companies to deliver high-quality web and mobile applications.
Sauce customers use the analytics data gathered from the tests they run to assess the health and effectiveness of their testing plans, track monthly usage, and evaluate the value of their Sauce subscription plan.
The Problem
Sauce product teams have historically focused more on the analytic needs of developers — those finding and fixing issues — and less on the needs of QA managers, Operations Specialists, and Administrators — those analyzing the effectiveness of their testing programs. To fill this gap, Sauce CSMs spend significant time manually assembling and presenting reports. Customers appreciate this level of attention, but it does not address underlying issues:
- Many customers do not have access to the basic information they need. They must contact a Sauce representative, which takes time and is a top pain point.
- The data in the reports they receive are not real-time. This limits their ability to adjust resource allocation quickly.
- Sauce CSMs spend too much time doing manual work. Access to data should be automated and self-serve. And CSMs should be focusing on higher-priority work.
Project Goals
- Users have access to relevant data, at all levels of our products, and within 12-24 hours of running tests.
- All users have the tools and the flexibility to configure their test results data in meaningful ways.
- Sauce CSMs no longer manually generate custom reports.
When implemented, we expect to see the following:
- Customers update their test strategy by balancing their test runs and taking advantage of their contracted concurrency amount, minimizing throttling.
- Customers purchase more concurrency to run more simultaneous tests.
- Sales and CSMs can more easily target customers for increases in concurrency.
The Team
- My Role: Lead Designer
- Product Manager
- Engineering Lead
- Developers (2)
Who are we designing for?

Ticket Analysis and Interviews
The PM and I interviewed key CSMs and reviewed tickets to identify the most significant pain points. This exercise helped us uncover critical missing information and informed prioritization. Usage analytics landed at the top of the list.


Continuous Discovery Interviews
Key findings from user interviews:
- Customers need to know where they are in their usage. “What's our usage per day? Per month? We’re flying blind. How much more do I have? Weekly would be good to have. Daily would be great. Monthly doesn’t help much, it’s too late. But weekly would help us set more realistic goals.”
- “Break usage down by branch, and by team.” Many customers have multiple product groups under same account. They would like to be able to identify which teams are efficient with their testing and which are not. — “That would help with planning on our end. To make a change and see a 12% reduction, that would be good to have.”
- “Can we not self serve?” Customers would like to look at the data, adjust, and build their own trends. They don’t want to have to contact Sauce for this information. — “Would be great as part of the dashboard, rather than a customized report.”
Comparative Analysis and Heuristic Evaluation
We examined other tools that our customers use as part of their tool chain — such as Gitlab and Github — to see how information is displayed and to see if there were ways to align experiences for users. We also evaluated our existing insights pages and discovered that each was created by a different product team without design system guidance, resulting in the following inconsistencies:
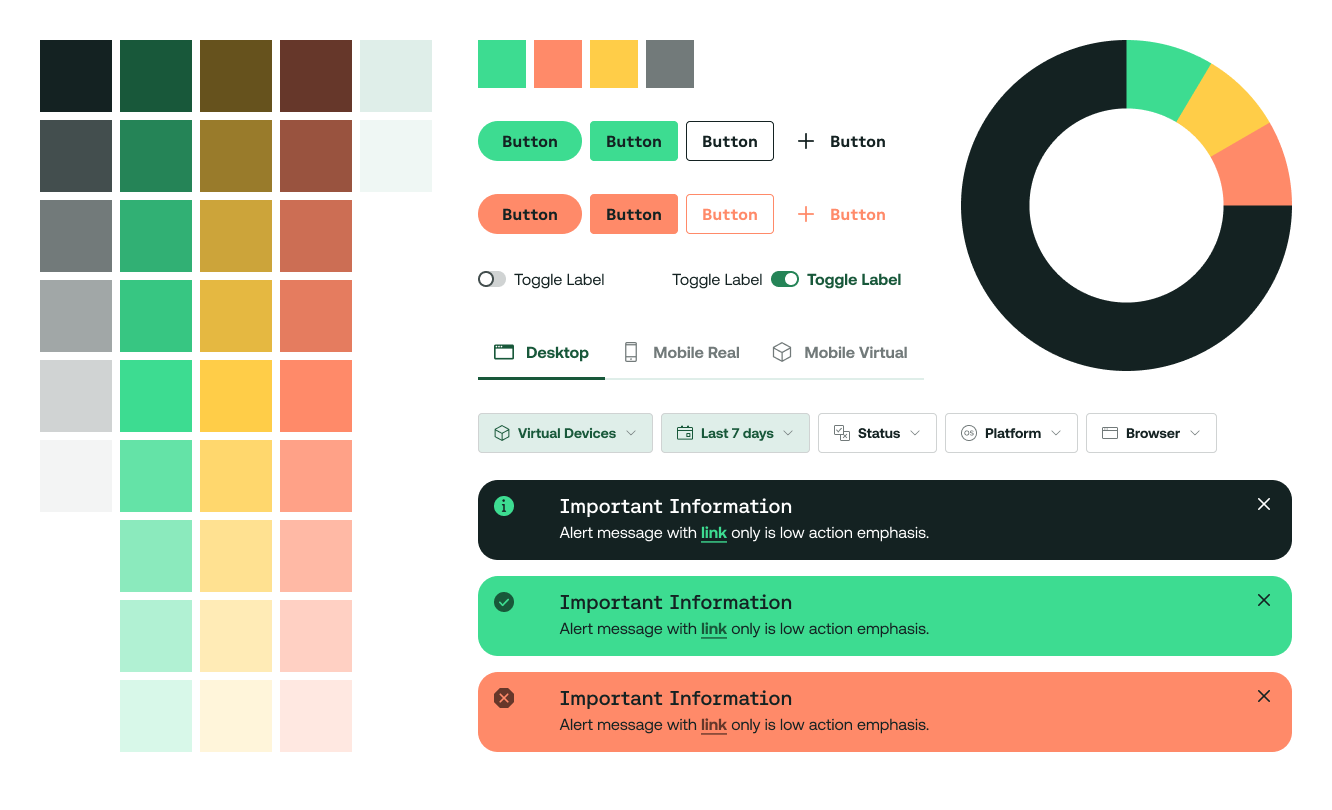
- Visual Language: No consistent use of button styles, layouts, or UI text.
- Functionality Location: No consistent page location for similar functions.
- Data Exporting: Inconsistent style usage, varying capabilities, and missing from some pages.
- Filtering: Inconsistent styling and filtering capabilities. Some use tabs instead of filters.

In addition to the above inconsistencies, users had no ability to view details.There was no connecting path between test overview insights and details for specific tests. This functionality would help users immensely.
Ultimately, our research showed that our priority should be usage analytics, ensuring customers could access usage information independently to evaluate their plan and adjust quickly, saving valuable resources and time.
Revised UI
After several sessions, iterating designs with customers and the product team, and considering the impact of UI changes, I completed a final version of updates that incorporated the following improvements:
- Redesigned filter bar with consistent behaviors and locations
- Standardized export data experience
- Guidelines for developers
- Highlighted data trends
- The ability for users to drill into test details
The implementation included improving sorting and filtering capabilities and creating a new filter component. We then implemented the new component across all pages as part of this phase — beyond MVP expectations.
Result
Our new analytics designs received a positive response from users. Increased usage demonstrated how informed improvements can help our customers. As a result, our roadmap became a company priority.